
Codex, OpenCode, and Claude Code all record usage. They keep it in different formats and different places. If I want one answer for today or this week, I shouldn't have to open three tools and add things by hand.
Token Bar is a small macOS menu-bar app that reads those local records and puts them in one view.
No account. No cloud dashboard. No provider usage API.
Read usage where it already lives
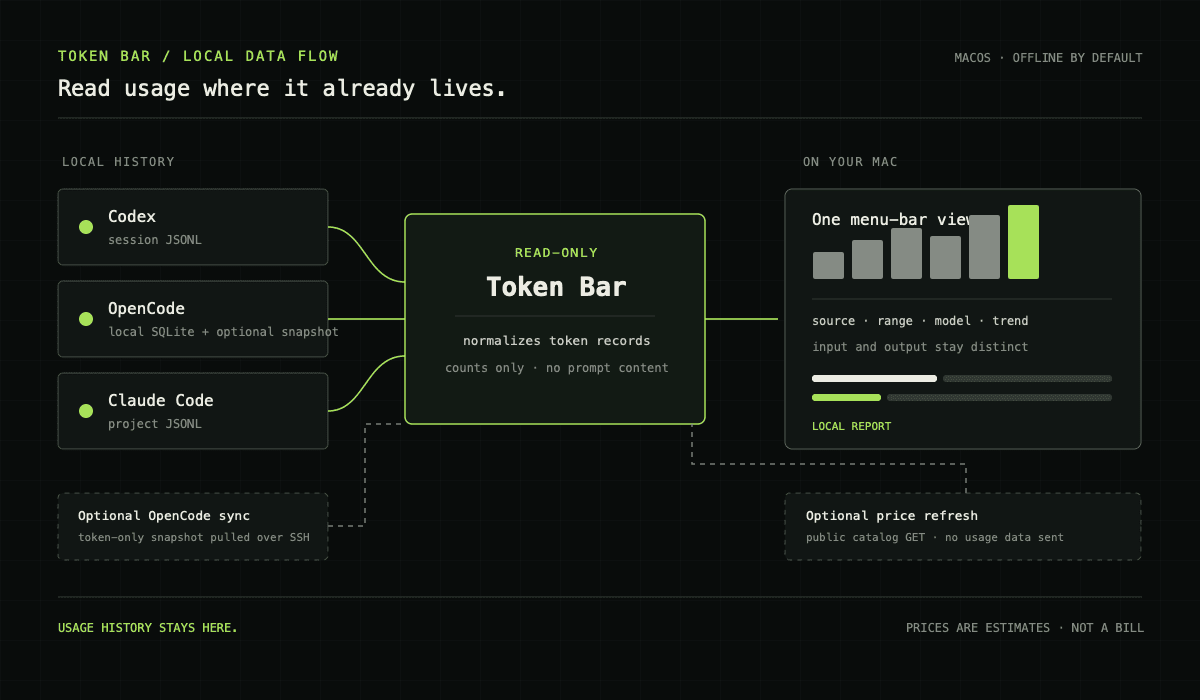
Token Bar reads Codex and Claude Code JSONL session histories, plus OpenCode's local SQLite database. Those reads are read-only. The app turns each source's usage records into the same shape: source, model, time, input, output, cached, and reasoning tokens.
The summary has source and time-range filters, an estimated cost, per-model breakdowns, and a trend that adapts to the range. Today and the last 24 hours use hourly buckets. A week, 30 days, or the best month uses daily buckets; lifetime uses monthly buckets. Quiet periods appear as zeroes, and the chart compares the selected period with the one before it.
Use it for ordinary questions: Which source did I use? How has this week changed? Which five models account for most of the activity?
A total needs accounting rules
Token fields overlap. Cached tokens are already part of input, and reasoning tokens are already part of output. Adding every displayed number together would inflate the total.
Token Bar keeps those relationships explicit. It shows input and output as separate measures, labels cache and reasoning as subsets, and avoids counting either subset twice. The compact interface uses paired input/output bars, with each subset labeled clearly.
Cost is an estimate based on the model and available rates. It is never a bill. When a fresh price isn't available, Token Bar can use its cached catalog or static estimates and label the rate basis. Use the estimate to compare activity over time; check the provider invoice for billed amounts.
Local first, with two opt-in exceptions
Normal usage reads stay on the Mac. Token Bar doesn't authenticate with provider accounts or call provider usage APIs. It doesn't use cookies or a cloud dashboard, and it doesn't send prompt or message content anywhere.
Two features can use the network, and both require an explicit action. A pricing refresh makes one public request for OpenRouter's model catalog; it sends no usage history. The other is optional OpenCode sync: Token Bar can pull a token-only snapshot over the SSH setup you already use, or you can copy a snapshot file yourself. Remote sync ships disabled, and the app stores no SSH password or key.
That boundary is the main design choice. A usage summary can be useful without exporting the activity that produced it.
Small enough to stay out of the way
The compact view puts the total, estimate, source filters, range filters, and short trend in the menu-bar popover. Details expands to show metric cards, source rows, the top five models, and a fuller chart. Settings hold the optional pricing and remote-sync controls, so they don't compete with the everyday summary.
Token Bar is open source. The product page has the current overview; the GitHub repository has the code, design notes, and release information.
Token Bar gives me one local view of the records already on my machine. Provider pages remain the source for billed amounts; Token Bar keeps estimates clearly labelled for comparison.