
A visual year tracker
Most yearly goals do not fail because they are bad. They fail because they disappear from view.
A goal starts in a Notion page, a Jira backlog, or a document. Soon, it becomes one item among dozens.
I built Quarter Clock to make that drift visible. It shows elapsed time beside the work that you completed.
The app answers one question: Is this project on track?
Why I built it
Calendars show dates. Task apps show lists. Neither one makes the gap between elapsed time and completed work clear.
I wanted a direct comparison. If 67% of a project timeline has passed, 30% completion is a warning.
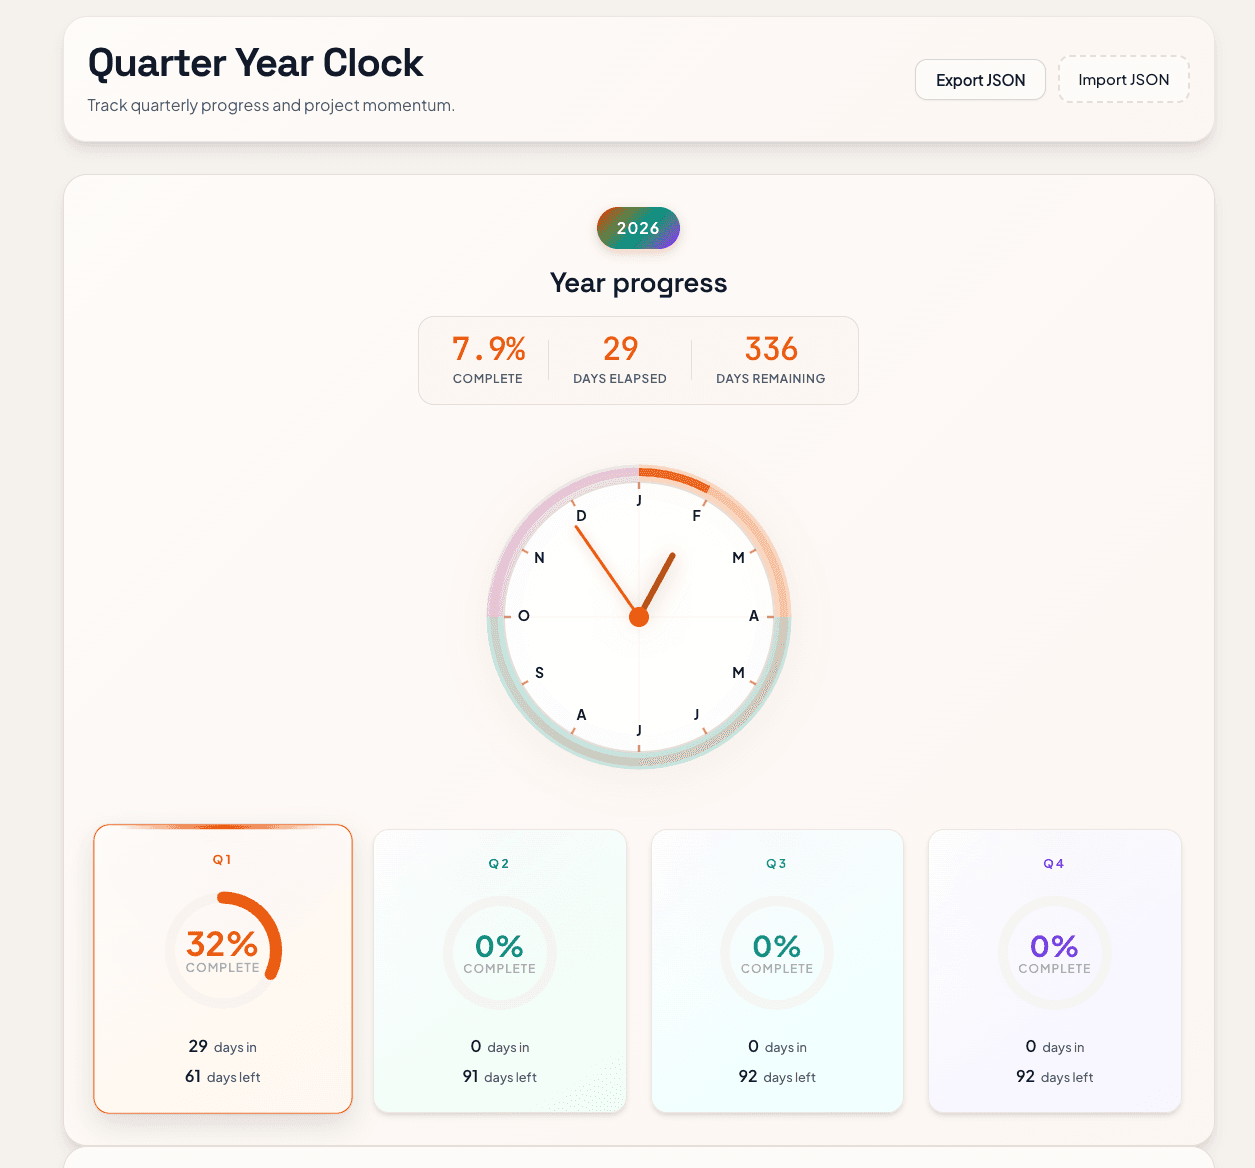
Quarter Clock turns that comparison into a dashboard. The dashboard shows the year, each quarter, and each project on one page.
It is not a task-management suite. It is a visual check on project momentum.
The interface
The year clock
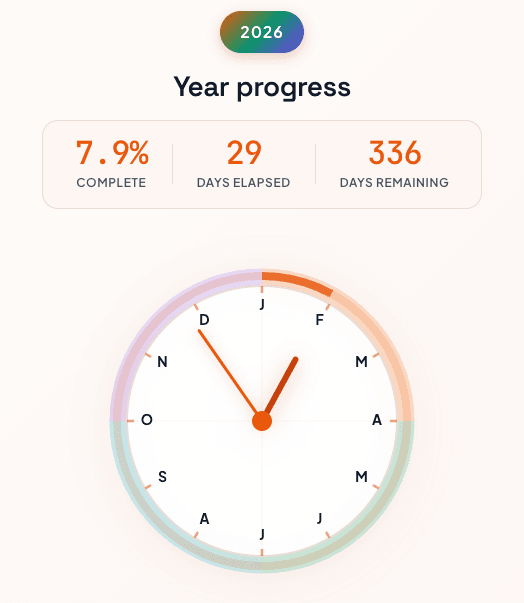
The main clock shows the current position in the year. Its month markers replace the hour markers of a normal clock.
Each colored arc represents one quarter. The hand moves through the year as each day passes.
Quarter progress cards
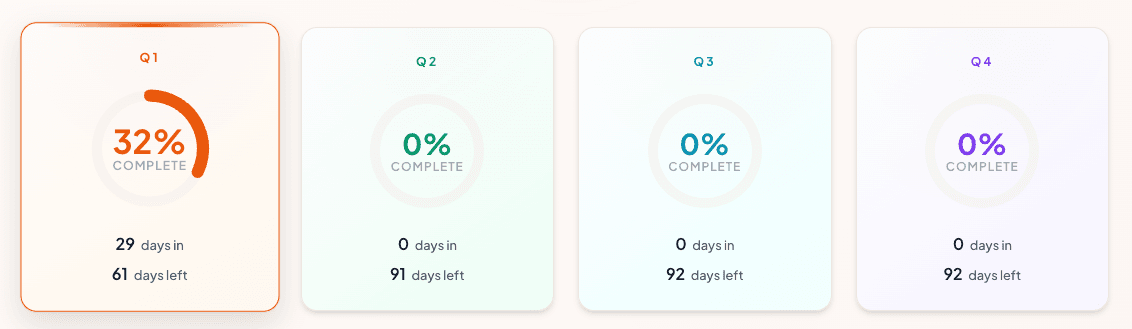
The four cards show the progress of Q1, Q2, Q3, and Q4. Each card shows:
- The completion percentage
- The number of elapsed days
- The number of remaining days
The current quarter has a stronger border. Future quarters remain at zero until they start.
The project list
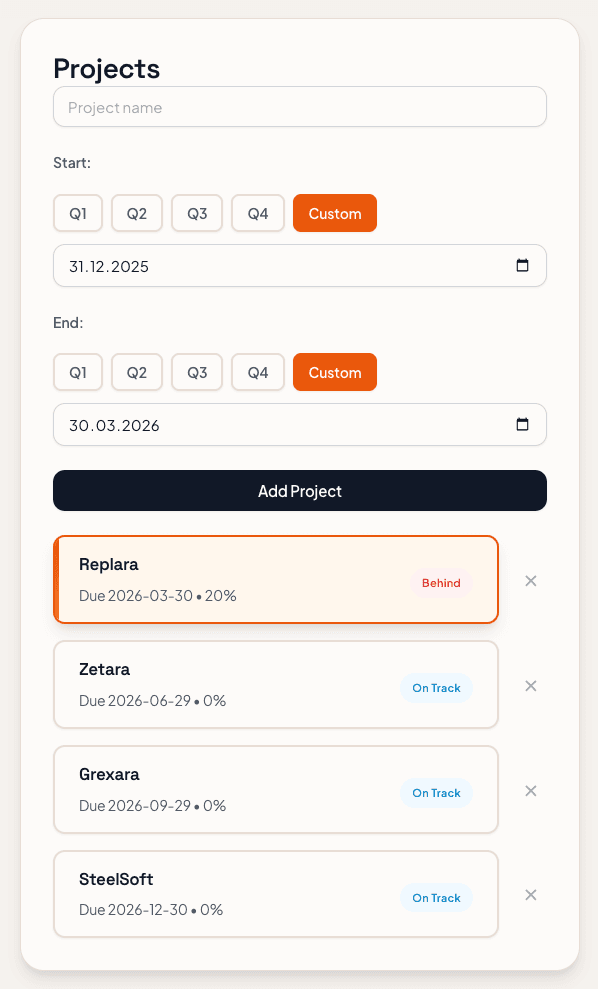
The project list contains the project name, deadline, completion value, and status. A project can cover one quarter or multiple quarters.
To add a project, enter its name and select its start and end dates. The quarter buttons can set those dates automatically.
Project details and subtasks
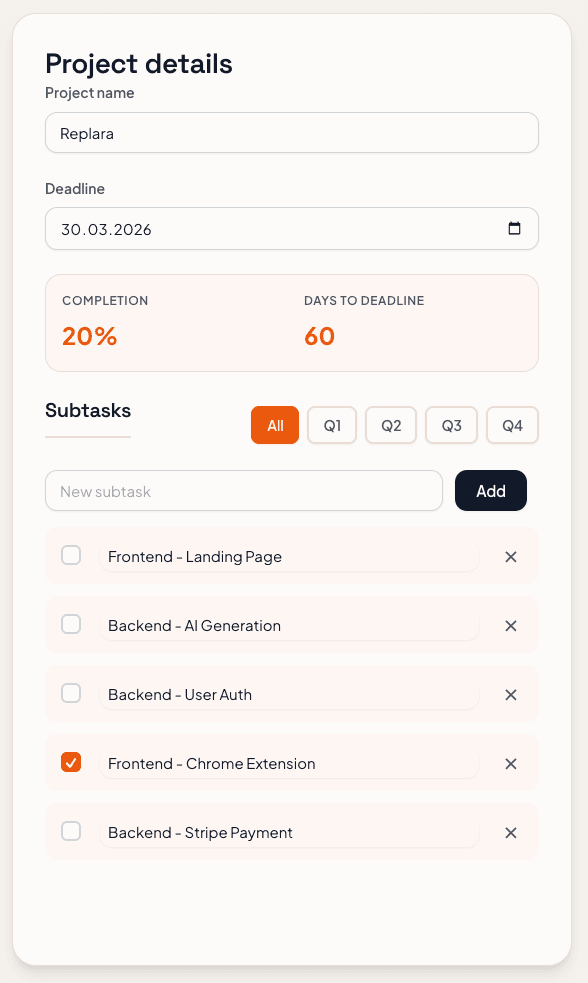
The details panel shows the selected project. It contains:
- The project name and deadline
- The completion percentage
- The number of days to the deadline
- The list of subtasks
Each completed subtask increases the project completion value. Quarter filters show the subtasks for projects that overlap the selected quarter.
Project status
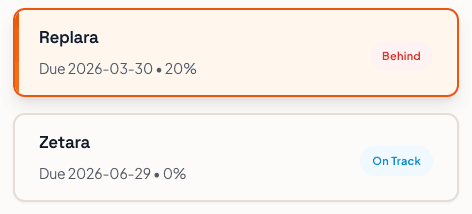
Quarter Clock compares actual completion with expected completion. Expected completion comes from the elapsed share of the project timeline.
The difference between these values is the delta:
- A delta of +10 percentage points or more means
Ahead. - A delta of -10 percentage points or less means
Behind. - A delta between those limits means
On Track.
The 10-point range prevents small schedule changes from producing a false warning.
Export and import

The export button downloads all project data as a JSON file. The import button restores data from that file.
This file provides a backup and transfers project data between browsers. The app does not synchronize data between devices.
How it works
Data storage
The app stores project data in the browser under one localStorage key:
const STORAGE_KEY = "quarter-clock";
The app reads that value when the page starts:
export const loadData = (): StoredData => {
  const raw = window.localStorage.getItem(STORAGE_KEY);
  if (!raw) return createEmptyData();
  return normalizeData(JSON.parse(raw));
};
Svelte saves the data after each change. The interface does not need a manual save button.
Browser storage has one important limit. If you clear the site data, the browser can delete your projects.
A JSON export provides a backup for important project data.
Quarter progress
Quarter progress uses the elapsed days and the total days in the quarter:
const percentComplete = (daysElapsed / totalDays) * 100;
The same calculation gives the progress of the full year. The date code also includes leap years and quarter boundaries.
Project status
The status calculation compares completed work with elapsed time:
export const getProjectStatus = (
  project: Project,
  quarter: QuarterInfo,
  today = new Date()
): ProjectStatus => {
  const completion = getCompletionPercent(project);
  const startDate = new Date(project.startDate + "T00:00:00");
  const deadline = new Date(project.deadline + "T00:00:00");

  const totalTime = daysBetween(startDate, deadline);
  const elapsed = daysBetween(startDate, today);
  const expected =
    totalTime <= 0 ? 100 : clamp((elapsed / totalTime) * 100, 0, 100);

  const delta = completion - expected;

  if (delta >= 10) return "ahead";
  if (delta <= -10) return "behind";
  return "on_track";
};
Actual completion comes from the subtasks. Expected completion comes from the start date, deadline, and current date.
Project completion
The app divides the number of completed subtasks by the total number of subtasks:
export const getCompletionPercent = (project: Project) => {
  const total = project.subtasks.length;
  if (total === 0) return 0;
  const done = project.subtasks.filter((task) => task.completed).length;
  return (done / total) * 100;
};
A project without subtasks has zero completion. Each subtask has the same weight.
The data model
The project data uses three small types:
export type Project = {
  id: string;
  name: string;
  startDate: string; // YYYY-MM-DD
  deadline: string;  // YYYY-MM-DD
  subtasks: Subtask[];
};

export type Subtask = {
  id: string;
  description: string;
  completed: boolean;
};

export type ProjectStatus = "ahead" | "on_track" | "behind";
The model contains only the data that the interface uses. It has no account, owner, or server metadata.
Why I used Svelte 5
Quarter Clock was my first Svelte project. I chose Svelte 5 because this small app gave me a safe place to learn it.
What worked well
Svelte state updates are direct. I change the project data, and Svelte updates the interface.
The components keep the markup, logic, and styles close together. This structure made the small codebase easy to read.
Svelte compiles the components during the build. The browser does not receive a virtual DOM runtime.
What worked less well
The Svelte ecosystem is smaller than the React ecosystem. Some niche problems have fewer packages and fewer detailed examples.
The editor tools worked, but the React and TypeScript tools still felt more mature to me.
React also remains the safer choice for many paid roles. Its market is larger.
My verdict
Svelte 5 fit this project. It kept the code direct and gave me a useful result after one weekend.
For work that depends on its ecosystem or job market, I will still use React. For a small browser app, I will use Svelte again.
Privacy and limits
Quarter Clock has no application backend. It also has no account system, database, or product analytics.
The application code does not send project data to an API. Project names, dates, and subtasks stay in the browser storage.
The page still makes normal infrastructure requests. Cloudflare serves the site, and Google Fonts supplies the fonts.
Those services can receive request metadata, such as an IP address. They do not receive the project data through the application code.
Local storage also has limits:
- The data does not synchronize between devices.
- Another browser profile cannot access the data.
- Clearing the site data can delete the projects.
- A JSON export is the only built-in backup.
This design is simple by choice. You get a local project tracker, not another subscription.
Try it or inspect the code
Quarter Clock is free and open source:
Use it, fork it, or report a problem. The MIT license permits all three.
The year keeps moving. The clock makes that fact difficult to ignore.
Built with Svelte 5. Your projects stay in your browser.